
If you're new to Google Ads, and even if you're old-hat, it can feel like a guessing game.
Is this a good click-through rate? Am I spending too much? Am I spending enough? What even is a good conversion rate?
As Google Ads fanatics ourselves, we get it.
It's frustrating trying to estimate what a good Google Ad campaign looks like, especially if you're new to ads, or if you're working in an industry where it's hard to find good data.
If you're tired of guesstimating what a good outbound marketing ad campaign looks like, the PPC experts here at Evenbound are here to help.
We've gone ahead and compiled data from our quality Google Ad campaigns, and segmented it by industry so you can take a look at live Google Ads data from a real digital marketing company that works with clients in your industry every day.

We've compiled Google Ads benchmarks for the following four industries:
- Manufacturing & Industrial
- Real Estate & Home Building
- SMBs - Small to Mid Sized Businesses
- Construction
All four of these industries have their own quirks when it comes to Google Ads. This data should help you figure out how your ad campaigns are measuring up to other quality campaigns in your industry.
Are you spending enough?
How much should you be paying for a conversion?
Let's find out.
Average Monthly Google Ad Spend by Industry
Before you can accurately assess your success against these benchmarks, it's important to understand how your spend plays into your results. Underfunding Google Ad campaigns can cut your results short, as your campaigns run out too early to produce real results.
On the other hand, overspending on a poorly targeted Google Ad campaign can be just as problematic. You're spending a lot of money to see very limited results.
So, how much should you be spending? Here's a look at our Google Ads benchmarks for average monthly spend by industry.
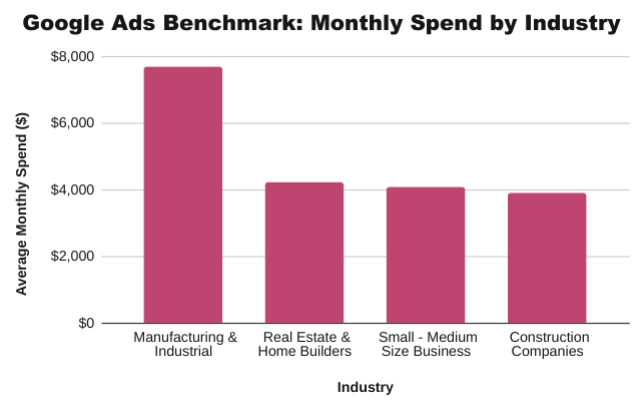
As you can see, Manufacturing & Industrial clients spend the most on Google Ads, with a total average of $7,689 per month. This makes sense, as most manufacturing companies are selling products at a high price point. Their returns are much larger, so it's reasonable to put a bit more behind their ad campaigns.
Real Estate & Home Builders are next with a $4,237 average monthly spend. Real estate is notoriously competitive, so again, it makes sense that their spend is slightly higher than SMBs and Construction Companies, which follow up with $4,082 and $3,891 per month, respectively.
Average Google Ad Cost-Per-Click by Industry
Now that you have a better idea of how much to spend overall, let's look at cost per click. How much are you paying for each person who clicks on an ad? Here are the benchmarks:
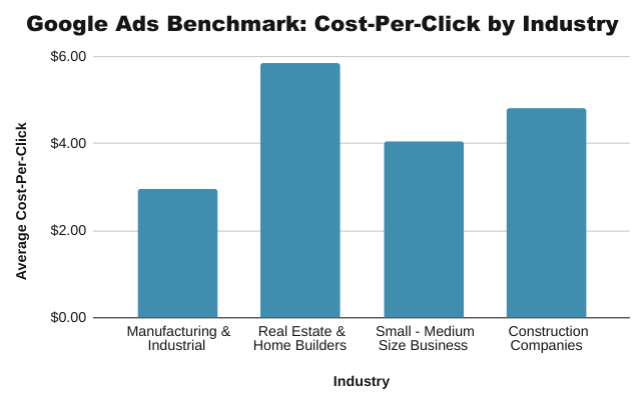
Real Estate & Home Builders are seeing the highest cost per click rate here at $5.85. Given the industry's competition, this makes sense. Construction Companies, many of whom target similar audiences as the real estate industry, also have a higher cost per click at $4.82.
SMBs are slightly lower with an average CPC of $4.04.
The surprising industry here is Manufacturing & Industrial. At just $2.96, their average CPC is much lower than the other three industries.
Average Google Ads Conversion Rate by Industry
Conversion rate (CVR) is the average number of conversions per ad interaction, shown as a percentage. Of all of the people who see and interact with your ads, what percentage of them convert on that ad? Here's a look at the CVR benchmarks by industry.
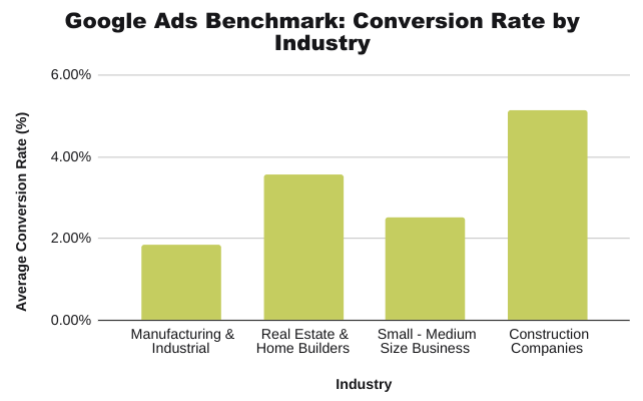
Construction Companies blew us away with an amazing 5.13% conversion rate.
Real Estate & Home Builders were next with 3.57%.
SMBs had an average conversion rate of 2.52%.
And Manufacturing & Industrial had an average CVR of 1.84%.
Average Google Ads Click-Through-Rate by Industry
Click-through-rate (CTR) tells us how many people are clicking through your ad, compared to how many people see the ad. Here's the lineup:
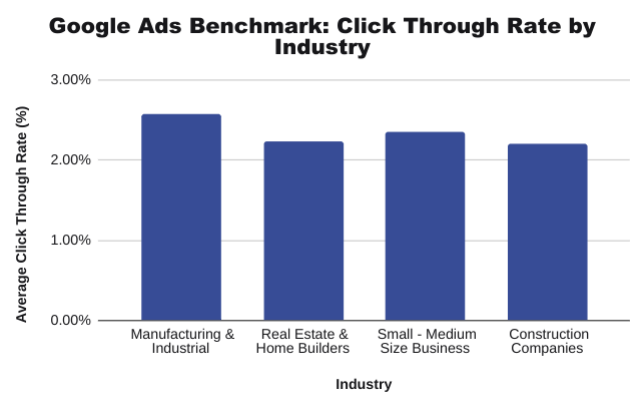
All four industries are relatively close here.
Manufacturing & Industrial sees the highest click-through-rate at 2.58%.
SMBs are next with 2.35%, followed by Real Estate at 2.23% and Construction at 2.20%.
These industry benchmarks are particularly useful here. There is so much out there about what your CTR should be, and plenty of experts say you should strive for 3% regardless of industry. The data shows that 3% isn't always practical.
Different consumers in different industries behave and interact with ads differently. That's why it's so important to use realistic, industry-specific benchmarks to measure the success of your ad campaigns.
Average Google Ads Cost-Per-Conversion by Industry
Cost-per-conversion is a favorite benchmark for many PPC experts. Basically, how much are you paying to get someone to convert on your ad?
It can be a good indicator of ROI, but again, it's important to understand cost-per-conversion benchmarks by industry, because every industry's average sale price is so different. Let's take a closer look at that:
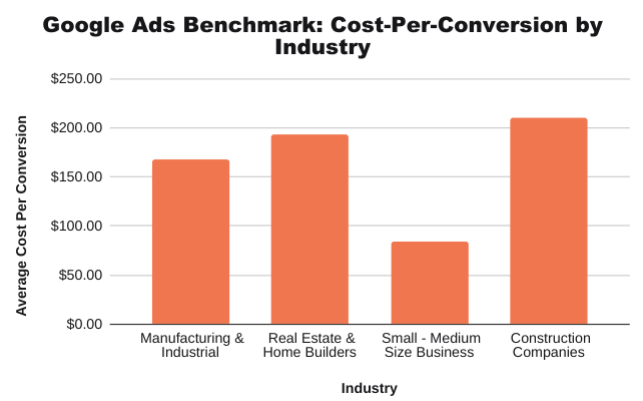
Construction Companies lead the pack here with an average cost per conversion of $211.01.
To an e-commerce business, that might sound astronomical. It's important to consider what that cost really means for your industry though.
A construction company's average project likely costs a few thousand dollars and upwards. If their Google Ads leads convert, and hire the company to build a commercial building in downtown Grand Rapids, that's easily hundreds of thousands of dollars, if not into the millions. And they spent just over $200 to make that happen.
The same goes for Real Estate & Home Builders. Their average cost per conversion is $193.75. At a glance that might look like a lot of money. But if you think of it in the context of building a brand new home, $200 is just a tiny percentage of the money they'll make from the lead who converted on that sale.
We can apply the same logic to Manufacturing & Industrial, with a cost/conversion of $168.10, and to SMBs, with their significantly lower cost/conversion of just $84.22.
How do you stack up against your industry's Google Ads benchmarks?
We've broken down each benchmark individually, so you can see how each industry stacks up against others. It's important to remember that you should really only be measuring your Google Ads campaigns against other similar campaigns in your industry. It's easy to see from this data that the average real estate consumer interacts with Google Ads very differently than a manufacturing consumer might.
With that in mind, here's a full look at all of the data for each industry:
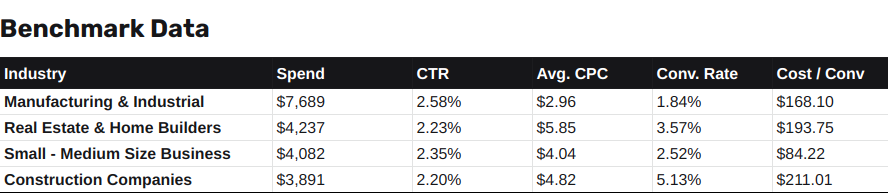
How do your ads stack up against these Google Ads benchmarks?
If your Google Ads campaigns just don't compare, there are plenty of workarounds and ways to get your data up to par.
Not sure where to start? Feel free to give the Evenbound team a call. Our paid ads team is happy to take a look at your campaigns and provide the advice you need to maximize your results.


-2.png?width=352&name=Untitled%20design%20(6)-2.png)